Is the Price Going Up or Going Down?

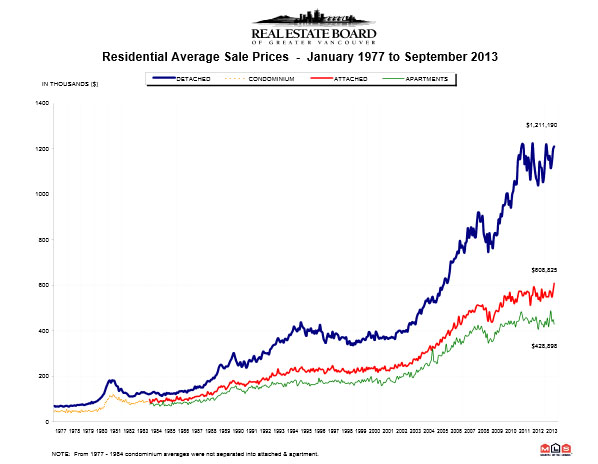
The Real Estate Board of Greater Vancouver reported the sales-to-active-listings ratio currently sits at 21.3% in Greater Vancouver, which is the highest it has been since June 2011.

What does that mean and how does it relate to questions like Where should I buy my next home? How much is my home worth?

The sales-to-active-listings ratio is used to as an indicator of supply and demand because it is simple to calculate and understand. The housing price is determined by supply and demand. When the supply of homes for sale (listings) and the demand from potential homebuyers is in equilibrium, we have a balanced housing market.

Seller’s market is when price appreciation above inflation is likely.

Buyer’s market is when price appreciation will be less than expected inflation.

Some say it is a balanced market when the sales-to-active-listings ratio is between 15-25%, some say it’s between 15-20%. A Vancouver local real estate veteran told me he has his own numbers of 12-22% as an observation after 30 plus years in the industry.

The real estate markets have some common drivers such as interest rates which are determined by inflation and economic growth. However, the real estate is very local. Drivers like demographics, income trends, population densities, net migration and share of first-time homebuyers have significant variation within a province or even neighborhoods within a city and it can lead to very different dynamics.

As a result, the BC Real Estate Association has performed a regression analysis to uncover the ratios for a balanced market in different real estate board regions in BC. In the analysis, it assumed balanced markets are markets in which home prices grow in line with inflation.

In Greater Vancouver, a balanced market has a sales/actives ratio of around 12-21%; In Fraser Valley, about 12-19% and in Victoria about 15-21%.

sales-active-ratio-bc

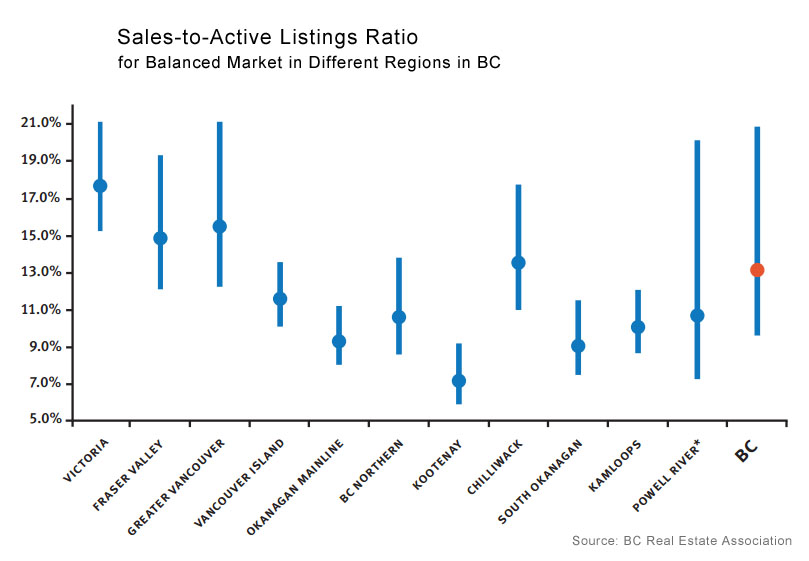
The REBGV reported the sales/actives ratio is 21.3% in Greater Vancouver in June, the highest since June 2011. This means that every 100 available homes on the market, 21.3 are sold every month and Greater Vancouver is seeing a balanced market tipping towards a seller’s market.

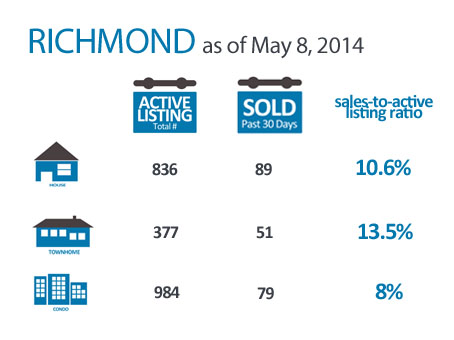
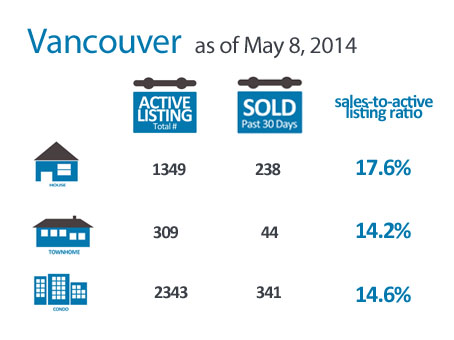
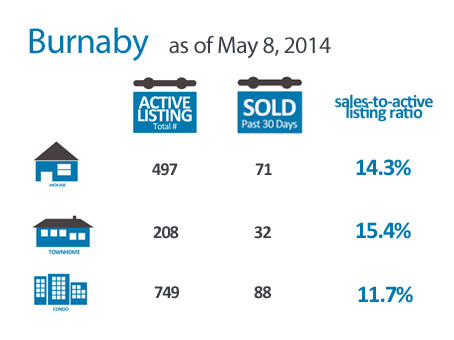
And let’s look at the Sales/Active Ratio for your city, your property type. Is it above or below the Greater Vancouver average? Is it a Seller’s, Balanced or Buyer’s Market? Is the price going up or staying flat?

Untitled-2

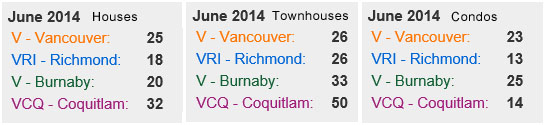
  • Vancouver all property types are showing a seller’s market meaning good time to sell for homeowners with healthy demand from potential homebuyers.
  • Burnaby townhomes are in hot demand but Coquitlam townhouses are super hot. A lot of demand from potential homebuyers and upward pressure on prices.
  • Richmond condos in balanced market but very close to buyer’s market. It is a good time to buy if you have been looking into buying a Richmond condo.

We can go even deeper into specific areas like the Olympic Village or Brentwood in North Burnaby to see what kind of market condition it is right now. Feel free to contact us about your specific area whether you are buying or selling.


May 2014 Greater Vancouver Housing Market

The Real Estate Board of Greater Vancouver (REBGV) Reported “Home buyer demand increases across Greater Vancouver Housing Market.”  According to Ray Harris, the REBGV president, the sales-to-active-listing ratio exceeding 20%, the most active marketplace since spring 2011. This indicates more home buyer demand today than at any point over the last three years.
Recently, the mortgage rate hit a new low with Investors Group’s 3-year variable rate at 1.99% followed by Scotiabank’s 5-year variable rate at 2.47%. A real estate expert with Queen’s University, John Andrew said it was likely that the other big banks would follow suit in today’s competitive market.

Condo King Bob Rennie’s Key-Note Address at Urban Development Institute

  • Baby Boomers and super seniors 75+ years old are sitting on $163.4 billion real estate equity
  • 1/3 of Greater Vancouver’s housing stock has more bedrooms than people (an 26% increase over the past 10 years)
  • The money is going to be freed up over the next 10 to 15 years, as these empty nesters downsize
  • Some of the money is used to help out children and grandchildren with their mortgage down payments
  • These wealthy boomers are looking for convenient locations with walking distance to coffee, groceries, pharmacies

To read more, click here.

How’s the Real Estate Market?

This is one of the most commonly questions we get as real estate agents.

My answer is — It depends.

It depends on where you live and if you are buying or selling, etc.

According to the Real Estate Board of Greater Vancouver the sales-to-active-listings ratio is 19.7% in Greater Vancouver last month, the highest since June 2011.
What this means is a balanced market where there are healthy activities from both home buyers and sellers. According to Ray Harris, REBGV president “People often look to buy or sell their home this time of year as the school year draws to a close and the summer holiday season is still a few months away.”
On the real estate price front, “Home prices in the region continue to show steady, yet modest, increases when compared to last year,” Harris said.

This is the statistics for all of Great Vancouver. But if we break it down to Vancouver, Burnaby and Richmond, and the different property types we can see quite a different picture.

APRIL stats APRIL stats - Vancouver APRIL stats - BU

In Vancouver, the Single Family Housing market is active. There are healthy supply of homes and good numbers of buyers purchasing these homes.
In Burnaby, Townhomes are popular among buyers.
In Richmond, we saw a lot of condominiums listed for sale but only 8% of the available condos were sold in the past 30 days and indicates a “buyer’s market” in Richmond.

As real estate agents, our job is to study home prices everyday so we can better answer your question about “how’s the real estate market?”
Please feel free to contact Jordan 604-773-6036 or Jenny 604-818-7317 for your specific real estate questions!

Steady Home Sale and Listing Activity in Greater Vancouver

According to the Real Estate Board of Greater Vancouver, March 2014 home sales increased 12.5% from March 2013 but were 17.2% below the 10-year sales average for the month.

The sales-to-listings ratio is 18.2% in Greater Vancouver. This indicated a balanced market.

REBGV president Ray Harris said “We continue to see steady and stable market conditions across the Greater Vancouver housing market; there has been a consistent balance between home seller supply and home buyer demand in our marketplace over the last year.”

“Home prices in the region have experienced incremental gains in most areas and property types over the last 12 months,” Harris said. “It’s important to remember that this is a diverse marketplace and trends will vary depending on area and property type.”

On the mortgage side, some chartered banks have lowered their posted five-year mortgage rate to 4.99% in the first quarter of 2014. This is the first time the 5-year posted rate has ever been below 5% and it comes at a time when consumer and mortgage credit growth has been slowing. Therefore, it is likely a promotional product from the banks to boost sales for mortgage loans and to compete for first-time buyers in the Spring season. The lower rates also offered some compensation for the recent increases to the CMHC mortgage insurance premiums.

mortage rates

However, the BC Real Estate Association is forecasting that the record low rates will be temporary and the Canadian economy is set to post stronger growth. The lower Lonnie is also aiding to spur inflation. They predicted that once positive news on the economy and higher inflation sets in, the rate would likely increase.

Below is the current mortage rate provided by Dominion Lending Centres:

Terms

Bank Rates

Our Rates

6 Month

4.00%

3.95%

1 YEAR

3.09%

2.89%

2 YEARS

3.04%

2.59%

3 YEARS

3.44%

2.79%

4 YEARS

3.94%

2.87%

5 YEARS

4.79%

2.99%

7 YEARS

6.04%

3.79%

10 YEARS

6.50%

4.49%

Rates are subject to change without notice. *OAC E&OE. Prime rate is currently 3%.

Open House March 23, 2014 from 2-4pm

2977 Wall St. Vancouver BC     2 Bed, 2 Bath     $645,900

UNIQUE Brand NEW WATERFRONT TOWNHOME in the Hastings Sunrise/East Village Neighbourhood. This RARE home features an OPEN living concept quality built by ARAGON. Thoughtfully designed with HIGH END finishing including GE Monogram ExecutiveCHEFS Kitchen, granite & marble counters, thick SOLID wood doors, Kohler fixtures, engineered Oak Floors, signature reclaimed brick walls, & GEOTHERMAL heating. Beautiful OPEN floorplan w a GAS FIREPLACE & PATIO off living space. Spacious bedrooms w BONUS DEN area & 2 LUXURY BATHS. Fantastic location close to shopping, restaurants, downtown, & N. Vancouver. 2-5-10 Home Warranty. Don’t miss out on this EXCLUSIVE opportunity to own! Call Jordan at 604-773-6035 today for your PRIVATE Viewing!

V1049197_201_94 V1049197_401_94 V1049197_501_94 V1049197_601_94 V1049197_701_94 V1049197_A01_94 V1049197_D01_94 V1049197_F01_94 V1049197_G01_94 V1049197_J01_94 V1049197_K01_94

CMHC to increase mortgage insurance premiums

Effective May 1, 2014, purchasers of owner occupied homes from 1 to 4 units requiring high-ratio mortgages (less than 20% down payment) will expect to see an average 15% increase in premiums. The increased premium will add approximately $5 to the monthly payments of an average Canadian home buyer requiring CMHC insured funding (about $248,000 in 2013) which is not expected to significantly impact the housing market. Mortgages currently insured by CMHC will not be affected. CMHC reviews its premiums on an annual basis and announces its decisions in the first quarter of each year. For more information, please click here

Government reduces tax burden on first-time buyers

Effective February 19, 2014, qualified first-time buyers are exempted from Property Transfer Tax when buying a home valued up to $475,000 (increased from $425,000). Partial exemption continues to apply to homes valued between $475,000 and $500,000. The property transfer tax is calculated at a rate of 1% on the first $200,000 and 2% on the balance of the purchase price. For more information, please click here

Home Insurance – What You Need to Know

What Kind of Home Insurance Is There?

  • Comprehensive Coverage – applies to both building and its contents (excluding items named specifically in the policy).
  • Basic or Named Perils Policy – covers against dangers that are named in the policy (ie. Fire, earthquake).
  • Broad Policy – provides comprehensive coverage on the building and named perils on the contents (usually cheaper than comprehensive coverage).
  • You can purchase additional coverage (usually in the form of named perils policy) to cover accidental damages not normally covered in a home insurance policy (ie. Sewer back up and furnace oil sills)
  • Renters’ Insurance – landlords are not responsible for the possessions of a tenant. I have seen a case in a condo where the fire sprinkler upstairs was activated and flooded the unit downstairs. The landlord’s insurance and the strata insurance covered the damages to the unit downstairs but not to the tenant’s possessions inside the unit.

How Much Will It Cost

  • Comprehensive coverage will cost the most but will provide the most coverage
  • Name perils policy costs less but may not cover all the damages you could suffer in an accident
  • Ask your insurance broker if you can get discounts for installing smoke alarms, sprinkler systems, monitored burglar alarms or if you’ve been the same insurance company for a long time.
  • The deductible may also affect the price of coverage (the more deductible you pay in case of damages, the less premium. Deductibles range from $200-$10,000).
  • The larger the risk a home carries, the more expensive to get it covered. Risks depend on the age of the home, if it has a wood stove or an underground oil tank, the location whether it is in earthquake zone, number of previous claims, the type of wiring, etc.
  • Some insurers are refusing to cover or renew policies on homes with 60-amp electrical service, aluminum wiring or knob-and-tube wiring.

Other Points to Consider

  1. Request for a homeowner policy once an offer has been accepted because most mortgage lender will require property insurance.
    Insurance companies will review a variety of factors such as certification of the fuel tank and the type of wiring (well and septic systems in rural properties).
  2. Most homeowners believed their policy would provide home replacement of like kind and quality in the event of a major loss but the most common homeowner policies DO NOT cover extra costs caused by code changes and other unexpected costs.
  3. Remember to increase your insurance coverage when your home has increased in value so you are covered because home reconstruction and replacement costs usually increase with home value.
  4. If a home is left unsupervised for an extended period of time, many property insurance policies will consider it empty and will not cover for vandalism or damages caused by an incident such as a water pipe break. Inform your insurance broker is you plan to leave your home vacant for an extended period of time and there is insurance that covers vacant properties.

FUN FACTS

Untitled-2

Source: The Canadian Real Estate Association 2005

Costs to Consider When Buying a Home

  1. Determine the amount you can put down for your down payment
    • Minimum 5% of purchase price
    • if less than 20% down payment, there’s additional insurance premium from CMHC Premium calculator
  2. Meet with your lender or mortgage broker to determine how much you can afford (maximum purchase price). You can use the Calculators on CMHC website to get some ideas but always meet with a lender to get pre-approval before shopping for a home to avoid disappointment later on in the process.
  • How much home you can buy is calculated based on mortgage payment, property taxes, heating costs, any current debts, gross monthly household income, home insurance, etc (depending on your lender).
  • Usually the monthly mortgage and housing cost should be no more than 28-32% of your gross monthly household income (some lenders use take-home pay instead of gross income)
  • Appraisal fee (some lenders pay for this)
  • GST/PST on newly constructed homes
  • Buyers pay Property Transfer Tax 1% on first $200,000 and 2% on balance (Sellers pay real estate commission)
  • Home inspection – around $300 for condos, $350-$400 for townhomes and $500 and up for houses depending on the size of the home.
  • Lawyer or notary public fees from $600-$1200 or more
  • Site survey for single family homes, move-in/move-out fees for condos
  • Title insurance is optional
  • Moving expenses
  • Homeowner insurance – you can get an online quote here
  • Heating, electricity, cable, internet, home phones, garbage, sewer, property taxes, municipal fees
  • Always have some savings for maintenance & repairs (for strata properties, major replacements or repairs may come in the forms of assessments in additional to the monthly strata fee)

Greater Vancouver Real Estate Market Condition September 2013

Accoridng to the Real Estate Board of Greater Vancouver home sales are up considerably from September 2012 which had one of the lowest sales in nearly three decades.

I heard the same comments from a lot of real estate agents that 2012 had been slower than usual.

Home sale and listing activity this September were in line with the 10-year average for the month:

New Listings all property types = 5,030   (5.5% decline from last September)

Current Listing all property types = 16,115   (12.2% decline from last September)

Sales-t0-active-listing ratio = 15.4%   (15-25% is balanced market)

Home prices have not changed much this year. The benchmark price for all property types (houses, townhouses, condos) in Greater Vancouver is $601,900.

It declined 0.7% from last September but increased 2.3% from this January.

Condo Sales increased 50.6%  (Sept 2012 vs Sept 2013) Benchmark price $366,600 decreased 0.5%

Townhome Sales increased 79.7%  (Sept 2012 vs Sept 2013) Benchmark price $458,300 unchanged

House Sales increased 72.2% (Sept 2012 vs Sept 2013) Benchmark price $922,600 decreased 1.4%

For more information about you specific neighborhood, please contact Jenny Chen at 604-818-7317 or jenny@ultimatehomeguide.ca

sept13graph