The Real Estate Board of Greater Vancouver released a stats report saying that March 2019 home sales were 46% below the 10-year March sales average and was the lowest total for the month in three decades.
Home sale is the number of transactions that took place in a month.
March 2019: Total 1727 home sales
March 2018: Total 2517 home sales
February 2019: Total 1484 home sales
Although sales in March was down from March last year or any month of March since 1986, home sales were up 16.4% from February 2019.
Below is a graph of homes sales in Greater Vancouver since 2005.

The number of home sales go up and down every year as activities pick up in the Spring and cool down as year end approaches. We can see that home sales are picking up a little bit since the beginning of this year.
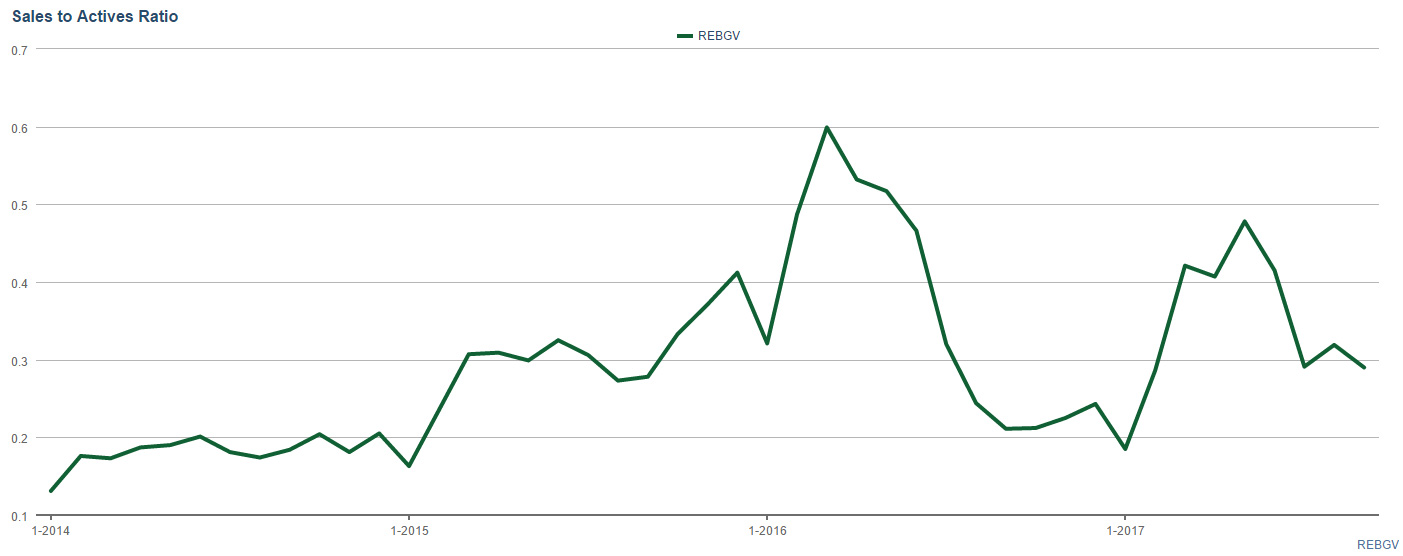
The sales number does not take into consideration of inventory. The sales to actives ratio is calculated by dividing home sales number by the number of active listings on the market in order to measure the balance of supply and demand.
For example, in March 2019 in Greater Vancouver for all property types, the sales to active ratio is:
1,727 home sales / 12,774 active listings = 0.135 or 13.5%
In another word,
12,774 active listings / 1,727 home sales = 7.4 months of inventory available
Some statisticians say that it is considered a buyer’s market when there are more than 6 months of inventory available in a give time. A balanced market has 4-6 months of inventory available and it’s a seller’s market when there’s less than 4 month’s inventory available.
From the graph below, we see the sales to active ratio since 2005 for the same time frame as the sales number graph above. We have not see such a strong seller’s market as the one we experienced in 2016 in ten years. The best buyer’s market was during the world financial crisis in 2009 (data available from 2005).

Sales to active listing ratio for March 2019 in Greater Vancouver fro the following property types:

Sources: Real Estate Board of Greater Vancouver
REBGV president Ashley Smith said “Housing demand today isn’t aligning with our growing economy and low unemployment rates. The market trends we’re seeing are largely policy induced. For three years, governments at all levels have imposed new taxes and borrowing requirements on to the housing market.”
“What policymakers are failing to recognize is that demand-side measures don’t eliminate demand, they sideline potential home buyers in the short term. That demand is ultimately satisfied down the line because shelter needs don’t go away. Using public policy to delay local demand in the housing market just feeds disruptive cycles that have been so well-documented in our region.”
To read the March 2019 stats report from the Real Estate Board, click here.